WiseTown Thematic Dashboard is an application that allows you to create custom visualizations to compare map information with statistical data and real-time data from satellite systems. The dashboards can manage economic, demographic, social, environmental and many other data.
WiseTown Thematic Dashboard is an application that creates customized views to compare cartographic information with statistical data and real-time data from satellite systems. All dashboards offer the highest degree of configurability and allow effective analysis of urban phenomena.
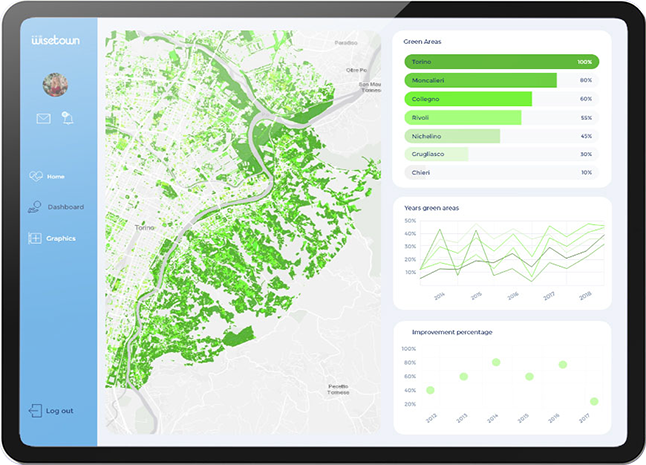
Among the many possibilities, there are time-lapse satellite dashboards for comparing the evolution of the phenomenon over time; dashboards for analyzing public parks and gardens for reports on health of plants and vegetation; dashboards on the degree of urban land consumption; dashboards with social and economic data on the population; dashboards on quality of life indicators; dashboards on the analysis of mobility flows; dashboards for monitoring the safety of the city and the territory.
Our interactive dashboards are map-based and contain statistical data analysis boxes with the ability to activate filters and selections to differentiate the display of information.
Awareness of the city's needs starts with a correct understanding of what is happening. Visualizing data on a map, facilitated by selected graphs and statistics, is essential to get inside the complexity of reality.
Public Administration, Cities, Energy Utilities, Smart Water, Public Safety Industries, Natural Resource Management